
|
Foxhound is the better* Database Monitor for SQL Anywhere.
*better: More thorough, more relevant, more effective.
...more Alerts, more All Clears, more details, more control in your hands.
|
Breck Carter
Last modified: May 1, 1996
mail to: bcarter@bcarter.com
"I have a PowerBuilder window that takes over 10 seconds to open and the users are accustomed to sub-second response time on the old mainframe application. How can I speed things up?"
It's tempting to say "give them all 150Mhz Pentiums" but that's not always possible. What the world needs is a good execution profiler for PowerScript, some utility that will tell you how much time is spent executing which lines of code in which script.
Execution profilers fall into four general categories: Statement Counters, Timing Tracers, Statistical Samplers and the Ultimate Probe.
A Statement Counter tells you how many times each line of code in each script was executed. This is not very helpful when analyzing performance because the number of times a statement executes doesn't necessarily tell you much about how fast or slow it is. For example, a = b and c = create d might both be executed 500 times but only one of them is a problem.
However, a Statement Counter makes an excellent debugging tool because it answers questions like "so THAT'S where the memory leak is, 500 create statements when one would suffice!" It also makes a great testing tool because it tells you which statements were never executed when you put the application through its paces, pointing out deficiencies in the test scripts.
A Timing Tracer tells you how much elapsed time is spent to get from "Point A" to "Point B" in your code. A crude tracer will force you to identify Point A and Point B while a good tool would provide some mechanism for automatically identifying "blocks of code". Different variations would give you raw data (500 figures if you executed a block of code 500 times) or summary reports (one total for all 500 executions of the block).
A zoom facility could be provided to narrow down the range when a hot spot is discovered, but therein lies the biggest problem with timers: the measurement of very short elapsed times can be inaccurate. The act of calculating elapsed times can affect the measurements themselves, and summarization of invalid data can produce some truly bogus results.
A Statistical Sampler interrupts your program from time to time, determines which line of code in which script was currently executing, and summarizes the results. This works like a public opinion poll where random samples give a pretty good idea of what people are thinking. If this tool takes its samples at some non-random rate, say 100 times a second, it is theoretically possible that program execution could be "synchronized" with the sampler to skew the results; e.g., it happens to be executing statement 47 every time a sample is taken but the rest of the time is spent somewhere else. In practice, however, this never happens and the results are reliable.
The Ultimate Probe would passively watch your code as it executes and accumulate a complete history of which lines of code were executed and how long they took. Ideally (and we're talking dreams here) the tool would be hardware based, wired into the test machine to watch without interfering. Something like a Periscope board.
I'd love to be able to review the Ultimate Probe and tell you where to buy it but I can't. It probably doesn't exist, certainly not one that would understand PowerScript and be able to report in terms of line numbers inside scripts inside objects.
I've actually written Statistical Samplers for ancient products like BASICA, the original BASIC Compiler and Turbo Pascal versions 3 through 6. The first was almost trivial in retrospect, and that would have been a good place to stop. The second was hard enough to be frustrating, and the third so mind-blowingly complex the aforementioned Periscope board was a necessity. The problem wasn't with reporting accuracy, it was figuring out how to map "address F000:24A7" back to a line in the source code.
Powersoft could make the task easier by providing some way of answering the question "which line of code is currently executing?" as Microsoft did with the BASICA interpreter. But they haven't, and without that facility even thinking about a statistical profiler for PowerBuilder is a futile exercise. It was hard enough dealing with DOS and discovering that the BIOS ain't reentrant and yes Toto that really does matter, but with Windows we're not in Kansas any more.
Likewise, a Statement Counter is up to Powersoft. For a great model they could look at the IBM mainframe product called the PL/I Checkout Compiler. Life was good, once upon a time, when it came to creating test scripts that ensured complete code coverage of huge applications. You'd just make a simple run, look at the Unexecuted Statement tables and start adding new test cases.
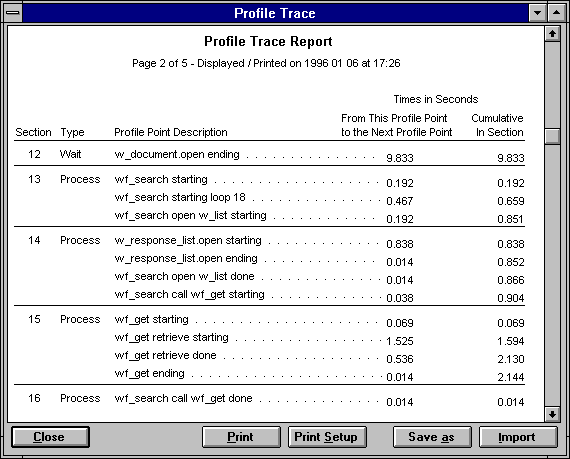
All that leaves is the Timing Tracer, and a crude one at that. Figure 1 shows an actual report from a real world application. The Type column indicates whether the time was spent waiting for user input (and should be ignored) or was spent doing some actual processing. The Profile Point Description is a programmer-provided text string that uniquely identifies some point in the PowerScript. The first time column shows how many seconds were spent in getting from this profile point to the next one. The column called Section and the rightmost time column lets the programmer identify logical blocks of code and see cumulative times.
Figure 1: A Timing Tracer In Action

As you can see from Figure 1 there are some large numbers being reported such as 0.8 and 1.5 seconds, certainly large when it comes to user impatience. To make a long story short, this information proved to be invaluable. Several of these hot spots came as a complete surprise to everyone, and some of them were very easy to fix: "We don't need to do that here." Other inefficiencies took a bit of effort to eliminate but only hours, not days or weeks. And great chunks of code took almost no time at all to execute, which was also a surprise: "I was sure that was the problem, good thing we didn't rewrite it."
To use this profiler, the programmer must add code to application scripts to identify the various "Points A and B" discussed earlier. Listing 1 shows the three simple function calls that produced the first three entries in Figure 1.
Listing 1: Calling The Timing Tracer
   f_prof_wait ( 'w_document.open ending' )
   . . .
   f_prof_section ( 'wf_search starting' )
   . . .
   f_prof_point ( 'wf_search starting loop 18' )
The call to f_prof_wait tells the profiler to treat the time spent from now until the next call as "waiting for user input". In this case the call was placed at the end of a window open script. After this point is reached the window is open and the application sits for almost 10 seconds waiting for the user to do something. It is certainly possible to reduce this time but not by any method I care to discuss.
The call to f_prof_section tells the profiler to treat the time as "computer processing", as does the call to f_prof_point. This is something we can deal with: look at the code that follows the call and change it to run faster.
Each and every f_prof_xxx call stops and records the accumulation of time that was started by the previous call, then starts the accumulation again. Both f_prof_wait and f_prof_section increment the section number by 1 while f_prof_point just uses the current section number.
Since all three do basically the same thing it's up to you to decide which function to call. If you don't care about "sections" or "waiting versus processing" all you need is f_prof_point. The same is true of the string parameter: all you need is something unique that lets you relate the report back to lines in scripts and values like "A" and "B" work just fine.
In real life, however, it's nice to know the difference between 10 seconds that must be ignored and 1 second that needs to be dealt with so f_prof_wait is handy. Also, in a real application you may be adding many dozens or hundreds of calls and testing over and over again as you zoom in on inefficiencies. It's hard to remember which calls came from where if you don't use long string parameters like in Listing 1.
We could use some kind of cool Custom Class (non visual) User Object instead of global functions but that would make the f_prof_xxx calls just a little more complex. It must also be kept in mind that all these calls are throwaway things and must be removed when you're finished optimizing the application, another reason to use the adjective "rudimentary" when describing this profiler.
Listing 2 shows the three global functions and how the real work is passed off to a global main window called w_prof_trace. It is this window that is shown in Figure 1, and it appears as soon as the first f_prof_xxx call is executed.
Listing 2: The Timing Tracer Functions
   f_prof_wait (string as_wait_title);

   // Make sure the profile window is
   // open and ready.
   if not IsValid ( w_prof_trace ) then
      open ( w_prof_trace )
   end if

   // Stop the clock to avoid including too
   // much of the profiler's own overhead.
   w_prof_trace.of_stop_clock()

   // End the previous profile period, start
   // a new 'Wait' period.
   w_prof_trace.of_record_profile_event &
     ( 'Wait', as_wait_title )

   // Start the clock for the new period.
   w_prof_trace.of_start_clock()

   f_prof_section (string as_process_title);

   if not IsValid ( w_prof_trace ) then
      open ( w_prof_trace )
   end if
   w_prof_trace.of_stop_clock()

   // Force a new section number for
   // the next period.
   w_prof_trace.of_start_new_section()

   // End the previous profile period, start
   // a new 'Process' period.
   w_prof_trace.of_record_profile_event &
      ( 'Process', as_process_title )
   w_prof_trace.of_start_clock()

   f_prof_point (string as_process_title);

   if not IsValid ( w_prof_trace ) then
      open ( w_prof_trace )
   end if
   w_prof_trace.of_stop_clock()
   w_prof_trace.of_record_profile_event &
      ( 'Process', as_process_title )
   w_prof_trace.of_start_clock()
Listing 3 shows the important stuff inside the global w_prof_trace window. This includes the three instance variables to keep track of time and section numbers, three tiny window functions to start and stop "the clock" and increment the current section number, and one huge function to put profile data into the dw_profile DataWindow control.
Listing 3: Inside W_Prof_Trace
   protected:
   long zil_start_msec = 0
   long zil_elapsed_msec = 0
   long zil_section_number = 0

   of_start_clock ();

   // Record the starting point for
   // another measurement.
   this.zil_start_msec = CPU()

   of_stop_clock ();

   // Record the elapsed time between when
   // the clock was started and now.
   this.zil_elapsed_msec &
      = CPU() - this.zil_start_msec

   of_start_new_section ();

   // Increment section number for
   // the next profile period.
   this.zil_section_number++

   of_record_profile_event
      (string as_period_type,
      string as_period_title);

   integer li_RC
   long    ll_row_count
   long    ll_row
   string  ls_period_type
   long    ll_section_number

   // Process previous row, if any.
   ll_row_count = this.dw_profile.RowCount()
   if ll_row_count > 0 then

      // Record previous row's time.
      this.dw_profile.SetItem &
         ( ll_row_count, 'period_msec', &
           this.zil_elapsed_msec )

      // Determine previous row's section.
      ll_section_number &
         = this.dw_profile.GetItemNumber &
            ( ll_row_count, 'section_number' )

      // Determine previous row's type.
      ls_period_type &
         = this.dw_profile.GetItemString &
            ( ll_row_count, 'period_type' )

   else
      ll_section_number = 0 // no previous row
      ls_period_type = '(None)'
   end if

   // All waits go in their own separate
   // sections, so start a new section if
   // the previous row was a wait and/or the
   // new row is a wait.
   if ( lower ( trim (ls_period_type ) ) &
      = 'wait' ) &
   or ( lower ( trim (as_period_type ) ) &
      = 'wait' ) then

      // Force a new section number if that
      // hasn't already happened via a
      // call to f_prof_section.
      if ll_section_number &
          = this.zil_section_number then
         this.of_start_new_section()
      end if
   end if

   // Start a new row.
   ll_row = this.dw_profile.InsertRow ( 0 )
   if ll_row < 1 then
      MessageBox ( 'Error', 'InsertRow' )
      halt close
   end if

   this.dw_profile.SetItem &
      ( ll_row, 'section_number', &
        this.zil_section_number )
   this.dw_profile.SetItem &
      ( ll_row, 'period_type', as_period_type )
   this.dw_profile.SetItem &
      ( ll_row, 'period_title', &
        as_period_title )
   this.dw_profile.SetItem &
      ( ll_row, 'period_msec', 0 )
The dw_profile control uses the tabular external source DataWindow object called d_prof_trace. You can see what it looks like in Figure 1, and Listing 4 shows how the columns are defined. Listing 5 shows the formulas for displaying and accumulating times in seconds. The cute little dots are left as an exercise for the reader; I'm sure you can do better because if you look closely at Figure 1 you'll see they don't line up very well.
Listing 4: D_Prof_Trace Columns
   type=number     name=section_number
   type=char(10)   name=period_type
   type=char(100)  name=period_title
   type=decimal(0) name=period_msec
Listing 5: Computed Fields
   period_sec:
      if ( period_msec = 0, '',
      string ( period_msec / 1000,
      '########0.000' ) )'

   cumulative_section_sec:
      if ( CumulativeSum ( period_msec
      for group 1 ) = 0, '',
      string ( CumulativeSum ( period_msec
      for group 1 ) / 1000, '########0.000' ) )
It's not nice to make editors scream in pain so a fair bit of code's been left out of this article. None of it is really necessary; for example, the code behind the Print, Save as and Import buttons is handy but except for remembering to call dwGroupCalc() after reset() and ImportFile() it's not too hard. And the fact that the code in w_prof_trace is actually split between two windows, an ancestor and a descendant, is simply because that will make it easier to derive the next version: a Timing Tracer that summarizes time spent in repetitive passes through the same points.
Some day I'll write that next version. Still rudimentary, but at least the report will be shorter and prettier and might even contain a histogram. In the meantime, if you want the full code for this version just send an email to one of the addresses listed at the end of this article. For my legacy coding friends it's in PowerBuilder 3, sure to be easily migrated to PB4 if you're keeping up with the times. For the compiled code produced by 32-bit version of PowerBuilder 5 it might be possible to use A Real Profiler, who knows?
Breck Carter can be reached by phone at (416) 763-5200 or via email at bcarter@bcarter.com.